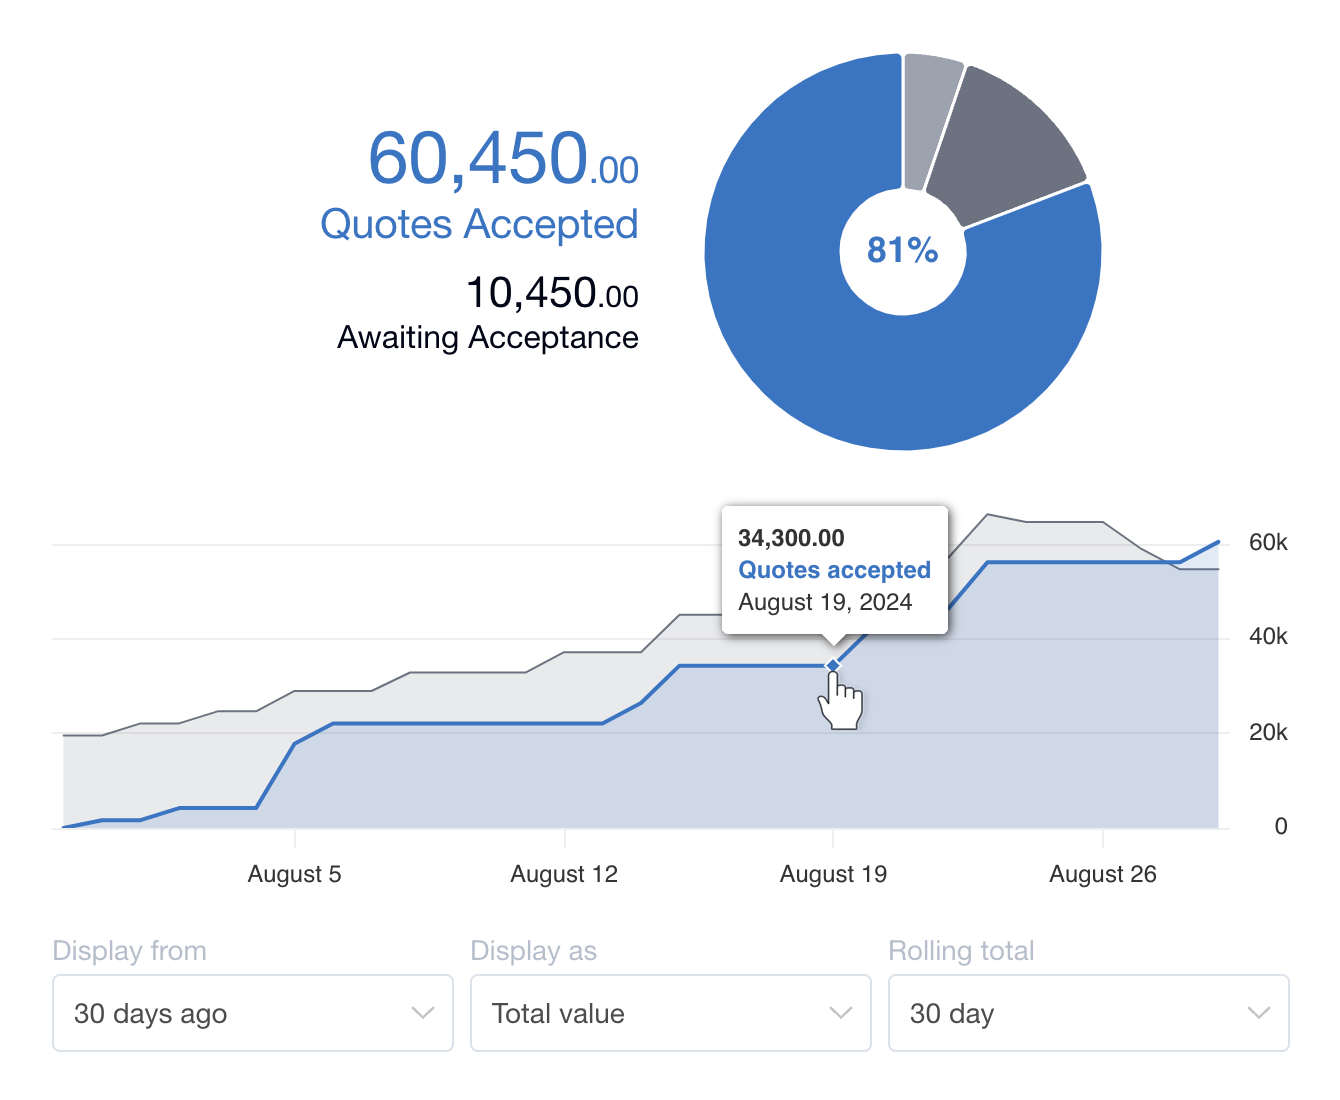
Dashboard Stats
The Dashboard Stats present your sales activity as an easy to digest overview. While simple in appearance, they allow you to gain meaningful insights into how your sales (and potential sales) are tracking over time.

Data is pulled from your quotes and displayed together in a pie chart and a line graph. This is a representation of your data for the timeframe and options defined by your filters.
Pie chart
The pie chart displays the percentage of Quotes Accepted and those that are still Awaiting Acceptance. If quotes are being edited, have expired, or have been declined, then these will display as a Not Accepted percentage.
Line graph
The line graph displays actual values of Quotes Sent and Quotes Accepted over the selected timeframe. The chart is plotted by day, or smoothed out as 7 or 30 day rolling values, depending on what filters are selected.
Filters
The filters affect both the pie chart and the line graph. They can be selected from these three drop-down menus:
Display from – 30, 90, 180, and 365 days ago. Years and Months are included here as time rolls on.
Display as – Total value of quotes, Average value of quotes, and by Count – which is the number of quotes.
Rolling total – 1, 7, and 30 days as a rolling total. This filter only affects the line graph.
Quotes excluded from the Dashboard Stats
Draft Quotes are not counted in the Dashboard Stats.
Quotes that have been Withdrawn are not counted in the Dashboard Stats. If you withdraw an old Quote, the Dashboard Stats will be updated retrospectively.
FAQ
What if a Quote was sent in a different month/year to when it was accepted?
If a Quote was created and sent in January, but it wasn’t accepted until March, then it would be counted in the Quotes Sent values for January, and it would be counted in the Quotes Accepted values for March.
If a Quote was sent in one calendar year but accepted in the next, it will be counted in the Quotes Sent values for the year it was sent, and in the Quotes Accepted values for the year it was accepted.
This is important when comparing your Dashboard Stats to data exported via the Import/Export tool, as exports are based on the Quote Sent date.
What if a Quote was originally sent in one month and re-sent in another month?
If a Quote was created and sent in January, but it was edited and re-sent in March, then it would still be counted in the Quotes Sent values for January. However, if when it was edited, the Quote Date was changed to March, then it would now be counted in the Quotes Sent values for March.
How do the rolling totals work?
The rolling totals only affect the line graph. A rolling total set to 30 days displays a cumulation of the last 30 days worth of values – a running total if you like. A rolling total set to 1 day displays the total value for each day.
How can I get more advanced analytics and reporting?
If you need to dig deeper, you can export your raw quote data as a CSV file. You can then compile your own custom statistics in a spreadsheet, like Google Sheets or Microsoft Excel.